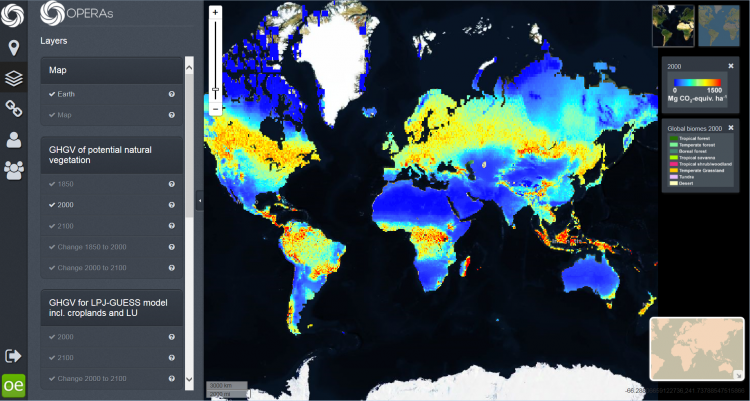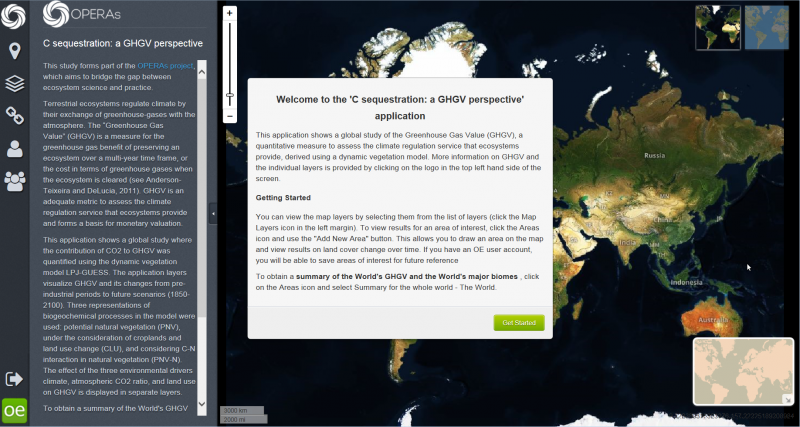
A new online mapping and visualization application (app) is available, presenting in an accessible way the research study by OPERAs researchers on Greenhouse Gas Value (GHGV) as a quantitative indicator of terrestrial carbon sequestration (see news article from April). The application was set up by Karin Viergever using the Ecometrica mapping platform to visualize the global modeling results. It shows maps of GHGV for different historical and future time steps, three representations of biogeochemical processes in the LPJ-GUESS model and maps giving the effect of the three environmental drivers climate, atmospheric CO2 ratio, and land use on GHGV. The application is accessed via this link: operas-ghgv.ourecosystem.com

The individual map layers can be viewed by clicking on the Map Layers symbol in the left margin of the app. To obtain a summary of the World's GHGV and the World's major biomes, click on the Areas icon and select the "Summary for the whole world" – The World. A query of this area gives an extensive report on all modeling results for major biomes that is also downloadable as pdf and spreadsheet. You can also create your own areas of interest by drawing on the map interface, by using the "Add new area" button.
Although several other apps are in progress, this app presents the first fully completed OPERAs project using Ecometrica's mapping and visualization tool. This is a beta-version and we would appreciate any feedback if you encounter problems or have comments on the application’s general content and set-up. Pleasedirect your feedback to Karin Viergever and Anita Bayer.
