
In my last blog post (see here) I presented the results of my Master’s thesis, which were all about evaluating ecosystem services in the Portuguese Montado landscape, which could potentially serve as a component for land management decision making. While I was using the models and tools to quantify the value of ecosystem services, some questions kept nagging at me: How close to reality are these numbers? Was I estimating the real, exact value of the landscape? Was the InVEST tool fit to produce reliable results?
I started to dig a bit deeper into the topic and found that researchers recently began to ask similar questions and started to assess the validity and accuracy of ecosystem services mapping tools. So I decided to incorporate this issue into my thesis and found that most of the papers that have been published so far find big differences in the results of these mapping tools. These differences either arise from taking values published in the literature rather than going out and making direct measurements or from using different mapping tools for the same data sets.
I found these results to be very interesting and wanted to take a closer look at the tool that I used for my research: InVEST. First, I went through all the input variables that were required for running the tool and ranked them according to their certainty as low, medium, or high – shown in green, yellow, or red in the diagram below- based on my estimations and opinions and those of my colleagues.
I used the certainty ranking to analyze the impact of the variables within InVEST. I found that if variables with low certainty sit at a crucial spot within the model, they leave the final result with reduced certainty as well. To see an example, let’s have a look at economic information for the timber model. In figure 4 you can see that one of the three components of the ‘economic information’ box has a low certainty, namely maintenance cost. Even after getting the detailed cost breakdown from Companhia das Lezírias and after talked to their forest manager Rui Alvez, it was still impossible to put a precise and reliable number to this value.
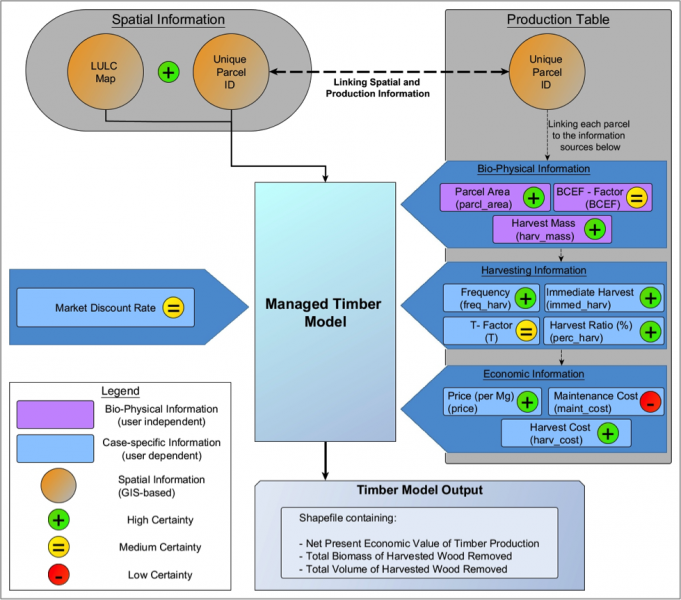
Figure: Visualization of the timber model with certainty ranking. The flowchart diagram represents the functioning and structure of the InVEST managed timber model. Spatial data is represented by circles, bio-physical information by green boxes, and case-specific information by yellow boxes. Green, yellow and red dots represent high, medium, and low certainty respectively. The distinction between bio-physical and case-specific input variables is fuzzy at times, because some input variables belong to both categories (e.g. the harvest mass is dictated by the bio-physical ability of the tree, but the tree species and the harvest procedures depend on the case study). The diagram shows only the options (and inputs) I employed to run the model.
One reason for this is the way the information is required by InVEST. The tool requires a cost per hectare value for maintenance costs. The answer we got from Rui was simply that this is not the way the land is managed. Instead, they manage the farmstead as a whole not calculating the expenses by hectare of land use type. And this leads directly to the second point: maintenance costs for my study area are impossible to break down and assign to a specific land use. For example pruning is done by an external company and throughout the whole farmstead. No one differentiates how much of the effort was spend on Montado with dense shrubs in comparison to a maritime pine stand with sparse understory vegetation.
The significance of ‘maintenance costs’ becomes more visible when trying to remember a simple calculation: profit equals revenue minus expenses. If one of these variables – in our case maintenance costs as part of expenses – are uncertain, the whole result will also be uncertain. This makes it hard to use such a generically calculated value to inform and eventually influence decision makers.
People who build computer models say, “Garbage in, garbage out.” Like all models, InVEST can be useful as a way to visualize and further develop our understanding. But also like all models, the results are only as good as the initial ingredients. The certainty and validity of InVEST greatly depends on the individual case and its data availability. Low data availability will drive the user to rely on data from the literature or rough estimates, and consequently reduce the output quality.
After gathering and weighing information and creating ecosystem service maps myself, I got a much better feeling for how much the process and its result depend on decisions made by the map creator and on the availability of sound data. Having felt that power makes me aware of the responsibility that comes with it in case the results are used for land management planning or payment for ecosystem service schemes. And this is part of the dilemma that comes with mapping. Gathering firsthand information is costly and tedious and simply cannot be done in every case an ecosystem service map is desired.
So, should we rely on mediocre data and accept the imperfect map that results, or should we make do without a map if we cannot afford to collect the perfect data set? This question touches a broader, almost philosophical topic and I do not dare to answer it yet. However, I can say that we need to be aware of the limitations that come with ecosystem service quantification and mapping on both ends of the process. This means that scientists need to communicate the uncertainties and drawbacks and decision makers need to factor these in and demand full transparencyof the creation process.
Overall, I learned that ecosystem service mapping is a complex field and results can vary between different tools and case studies, especially when information is scarce and data is uncertain. I hope that my experiences using the InVEST tool can have a voice in the emerging discussion about the validity and usefulness of ecosystem service mapping and in the long run help to make better decisions about our landscapes in the future.